Reading Hugging Face’s Download Distribution as a Signal About Compute Markets
Understanding how demand for open-weights models affects demand for compute

Please see relevant disclosures here.
Summary
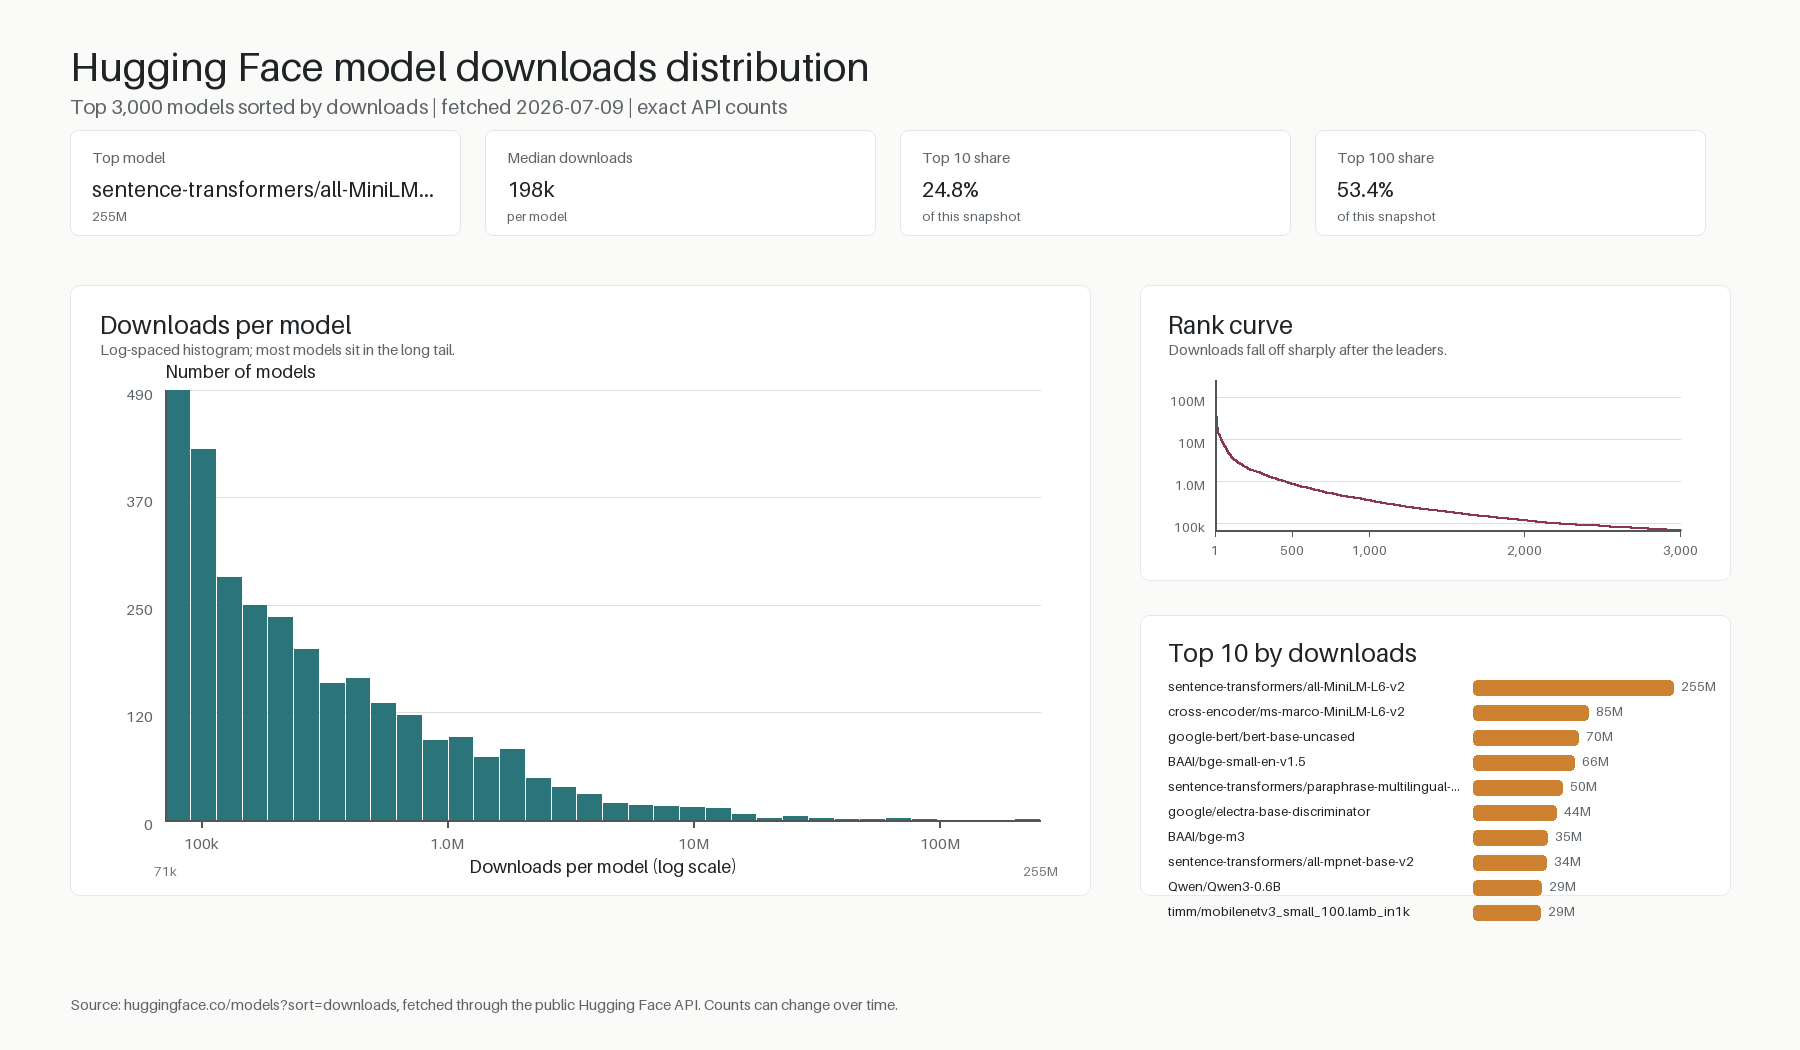
A July 9, 2026 snapshot of the 3,000 most-downloaded models on Hugging Face shows a highly unequal, power-law-like distribution. The leading model, sentence-transformers/all-MiniLM-L6-v2, recorded 255.4 million downloads, or 9.1% of the downloads within the sample. The top ten models captured 24.8%, the top 100 captured 53.4%, and the top 500 captured 79.1%. The sample’s Gini coefficient is approximately 0.78, indicating substantial concentration.
That does not mean compute spending is concentrated in the same proportions. Hugging Face downloads measure the retrieval of model-related files, not training runs, inference requests, tokens, accelerator-hours, or revenue. In fact, the composition of the most-downloaded models points toward a broader and more heterogeneous compute market than the phrase “LLM market” suggests. Text-generation models produced only 17.6% of sample downloads. Embedding, similarity, feature-extraction, and ranking models collectively accounted for more, and only one of the ten most-downloaded repositories was tagged for text generation.
The most defensible conclusion is therefore not that a handful of frontier LLMs will capture the compute market. It is that AI infrastructure is developing a barbell structure: a relatively small number of extremely popular models justify dedicated, heavily optimized serving systems, while thousands of less predictable models favor shared, serverless, and flexible capacity. At the same time, the popularity of compact encoders and specialist models creates demand for CPUs, lower-cost GPUs, custom accelerators, memory bandwidth, storage, and edge hardware alongside the largest accelerator clusters.
What the Data Measures
The dataset covers the top 3,000 Hugging Face model repositories sorted by their public downloads field. Importantly, this is not an all-time measure. Hugging Face defines the field as downloads over the previous 30 days. It is also not an LLM-only list: the Model Hub includes text, vision, audio, multimodal, forecasting, classification, and other machine-learning models.
A Hugging Face “download” is best understood as a server-side file-access event. The platform counts GET and HEAD requests for designated files, such as a configuration file or a library-specific model file. It uses these selected “query files” to avoid counting every shard of a model as a separate download. The files used differ across libraries. Hugging Face also notes that more granular analysis would be required to exclude automated pipelines or deduplicate users. Consequently, downloads are a useful indicator of model distribution and developer activity, but not a direct measurement of production use. More information about Hugging Face’s methodology can be found here.
The concentration figures in this report are also shares of the observed top-3,000 sample, not shares of the entire Hugging Face Hub. Millions of lower-ranked repositories are excluded. Their individual counts are small, but their combined activity is unknown.
The Shape of the Distribution
The 3,000 repositories recorded a combined 2.81 billion download events during the measured period. The distribution spans more than three orders of magnitude: the first-ranked model had 255.4 million downloads, while the 3,000th had 71,206. The sample median was approximately 197,500.
Concentration increases rapidly near the top:
- The leading model represented 9.1% of sample downloads.
- The top ten represented 24.8%.
- The top 100 represented 53.4%.
- The top 500 represented 79.1%.
- The top 1,000 represented 89.2%.
This is clearly a “hits” market, but not a market in which the head eliminates the tail. Models outside the top 100 still produced 46.6% of observed downloads. Even within a deliberately top-heavy sample, a large amount of activity is distributed across hundreds or thousands of repositories.
More revealing is the type of model being downloaded. Text generation was the largest individual task category at 17.6%, but sentence similarity was almost equal at 17.5%. Feature extraction added 6.8% and text ranking another 4.1%, putting these three retrieval and embedding-related categories at approximately 28.4%. Image-to-text models accounted for 10.1%, speech recognition for 6.6%, and fill-mask models for 7.1%.
Only one of the top ten repositories, Qwen/Qwen3-0.6B, was tagged for text generation. The remainder were primarily compact embedding, ranking, encoder, or classification models. This matters because a download ranking dominated by reusable infrastructure components has different compute implications from one dominated by giant generative models.
Implications for Compute Markets
A barbell market is emerging
The distribution supports two distinct serving models. At the head, exceptionally popular models can sustain dedicated infrastructure. Providers can pre-load weights, compile optimized kernels, batch requests, cache embeddings, and tune hardware utilization around a predictable workload. Small improvements applied to a model with hundreds of millions of download events can have considerable economic value.
The long tail has different requirements. Most models cannot keep a dedicated accelerator continuously occupied, but their aggregate demand remains meaningful. This favors multi-tenant endpoints, serverless inference, aggressive model loading and eviction, shared memory pools, and routing systems that place each workload on the least expensive suitable hardware.
The result is not one homogeneous “GPU rental” market. It is a combination of industrialized, high-utilization model factories at the top and a pooled catalog service across the tail.
Download concentration does not equal compute concentration
A downloaded model may never be executed, or it may be downloaded once and then answer billions of requests. Two models with identical download counts can differ by orders of magnitude in parameter count, context length, request volume, batchability, and hardware requirements.
Large generative models are expensive per invocation, while many highly downloaded embedding and classification models are comparatively cheap. Weighting the ranking by estimated operations, memory consumption, or inference tokens could therefore reorder it dramatically. A lower-ranked frontier model might generate much more accelerator revenue than a higher-ranked compact encoder.
Training compute is almost entirely absent from the measurement. Hugging Face shows the downstream distribution of model artifacts, not the resources used to create them. Frontier training is likely more concentrated than this download distribution because only a relatively small number of organizations can finance and operate the largest clusters.
The market extends well beyond top-end GPUs
The strong showing of compact embedding, ranking, classification, and speech models suggests persistent demand for a wide spectrum of hardware. Many such models can run effectively on CPUs, modest GPUs, inference accelerators, laptops, or edge devices. Their economics are often dominated by memory bandwidth, latency, utilization, and data movement rather than maximum training throughput.
This makes hardware matching an important competitive capability. Providers that can route a workload among CPUs, commodity GPUs, premium GPUs, and custom silicon may achieve better margins than providers that treat every model as a candidate for the newest accelerator.
The hyperscalers are already moving in this direction. Microsoft reports that hardware and software optimization improved inference throughput for its most-used Copilot models by 40%, while its Maia accelerator improved tokens per dollar by more than 30% relative to other silicon in its fleet. Alphabet similarly reported reducing Gemini serving unit costs by 78% during 2025 through model optimization, utilization, and infrastructure improvements.
Value is shifting toward execution efficiency
Open model weights reduce scarcity at the model-access layer. When several capable models can be obtained at little or no licensing cost, competition moves toward serving them cheaply and reliably. Quantization, compilation, batching, caching, observability, security, and workload scheduling become central sources of differentiation.
The concentration of downloads in standardized libraries reinforces this. Transformers accounted for 55.4% of downloads in the sample, and Sentence Transformers accounted for another 26.8%. Although the figures require caution because Hugging Face uses different counting rules for different libraries, the broad pattern suggests that a small number of software interfaces mediate a large portion of open-model adoption. Hardware that integrates smoothly with those interfaces has a much easier route to market.
This creates an opportunity for custom silicon, but it does not imply an immediate collapse in demand for NVIDIA GPUs. Amazon reported in April 2026 that its combined Graviton, Trainium, and Nitro chip business had exceeded a $20 billion annual revenue run rate, while it was simultaneously expanding its NVIDIA fleet.
Infrastructure can remain concentrated even when models are open
The Hugging Face distribution should not be read as evidence that AI infrastructure is becoming capital-light. Microsoft expects approximately $190 billion in 2026 capital expenditure and says it expects capacity constraints to persist through the year. Alphabet projects $175 billion to $185 billion, primarily to support technical infrastructure and AI demand. NVIDIA’s data-center revenue reached $75.2 billion in its fiscal first quarter of 2027, up 92% year over year.
Open weights may actually strengthen the largest infrastructure platforms. A hyperscaler can aggregate the fragmented demand for thousands of models, operate shared capacity at higher utilization, and amortize custom silicon and networking investments across many products. Smaller providers need a sharper advantage, such as access to scarce GPUs, lower energy costs, superior orchestration, geographic specialization, privacy, or unusually transparent pricing.
Limits and Further Analysis
A compute-market forecast should not use downloads alone. The next stage would combine this dataset with parameter counts, precision, model-file sizes, estimated operations per request, active deployment counts, token or query volumes, and observed hardware utilization. It would also separate training, fine-tuning, batch inference, real-time inference, and local execution.
The ideal unit of analysis is closer to successfully processed work per dollar, watt, and second than to model downloads. Downloads are best treated as evidence of ecosystem attention and possible deployment breadth.
Conclusion
The distribution suggests that open-model adoption is concentrated, but the corresponding compute opportunity is diversified. A few models attract extraordinary attention, creating valuable targets for dedicated optimization. Beneath them lies a large aggregate tail that rewards flexible, multi-tenant infrastructure.
Most importantly, the list is not dominated by giant text-generation models. Compact encoders, embedding systems, rankers, vision models, and speech models are deeply embedded in the market. Compute demand is therefore likely to spread across premium accelerators, lower-cost GPUs, CPUs, custom chips, storage, networking, and edge devices.
The Hugging Face ranking is a useful map of where developers are reaching for model artifacts. It is not a map of where compute revenue is earned. Its strongest message is that the winning compute platforms will need both scale and range: the ability to industrialize a few enormous workloads while serving a constantly changing catalog of smaller ones efficiently.
If you enjoy this newsletter, consider sharing it with a colleague.
I’m always happy to receive comments, questions, and pushback. If you want to connect with me directly, you can:
very interesting. thanks