The $176 Billion Accounting Question at the Heart of the AI Boom
How a boring depreciation debate could determine whether hyperscaler earnings are real or an illusion

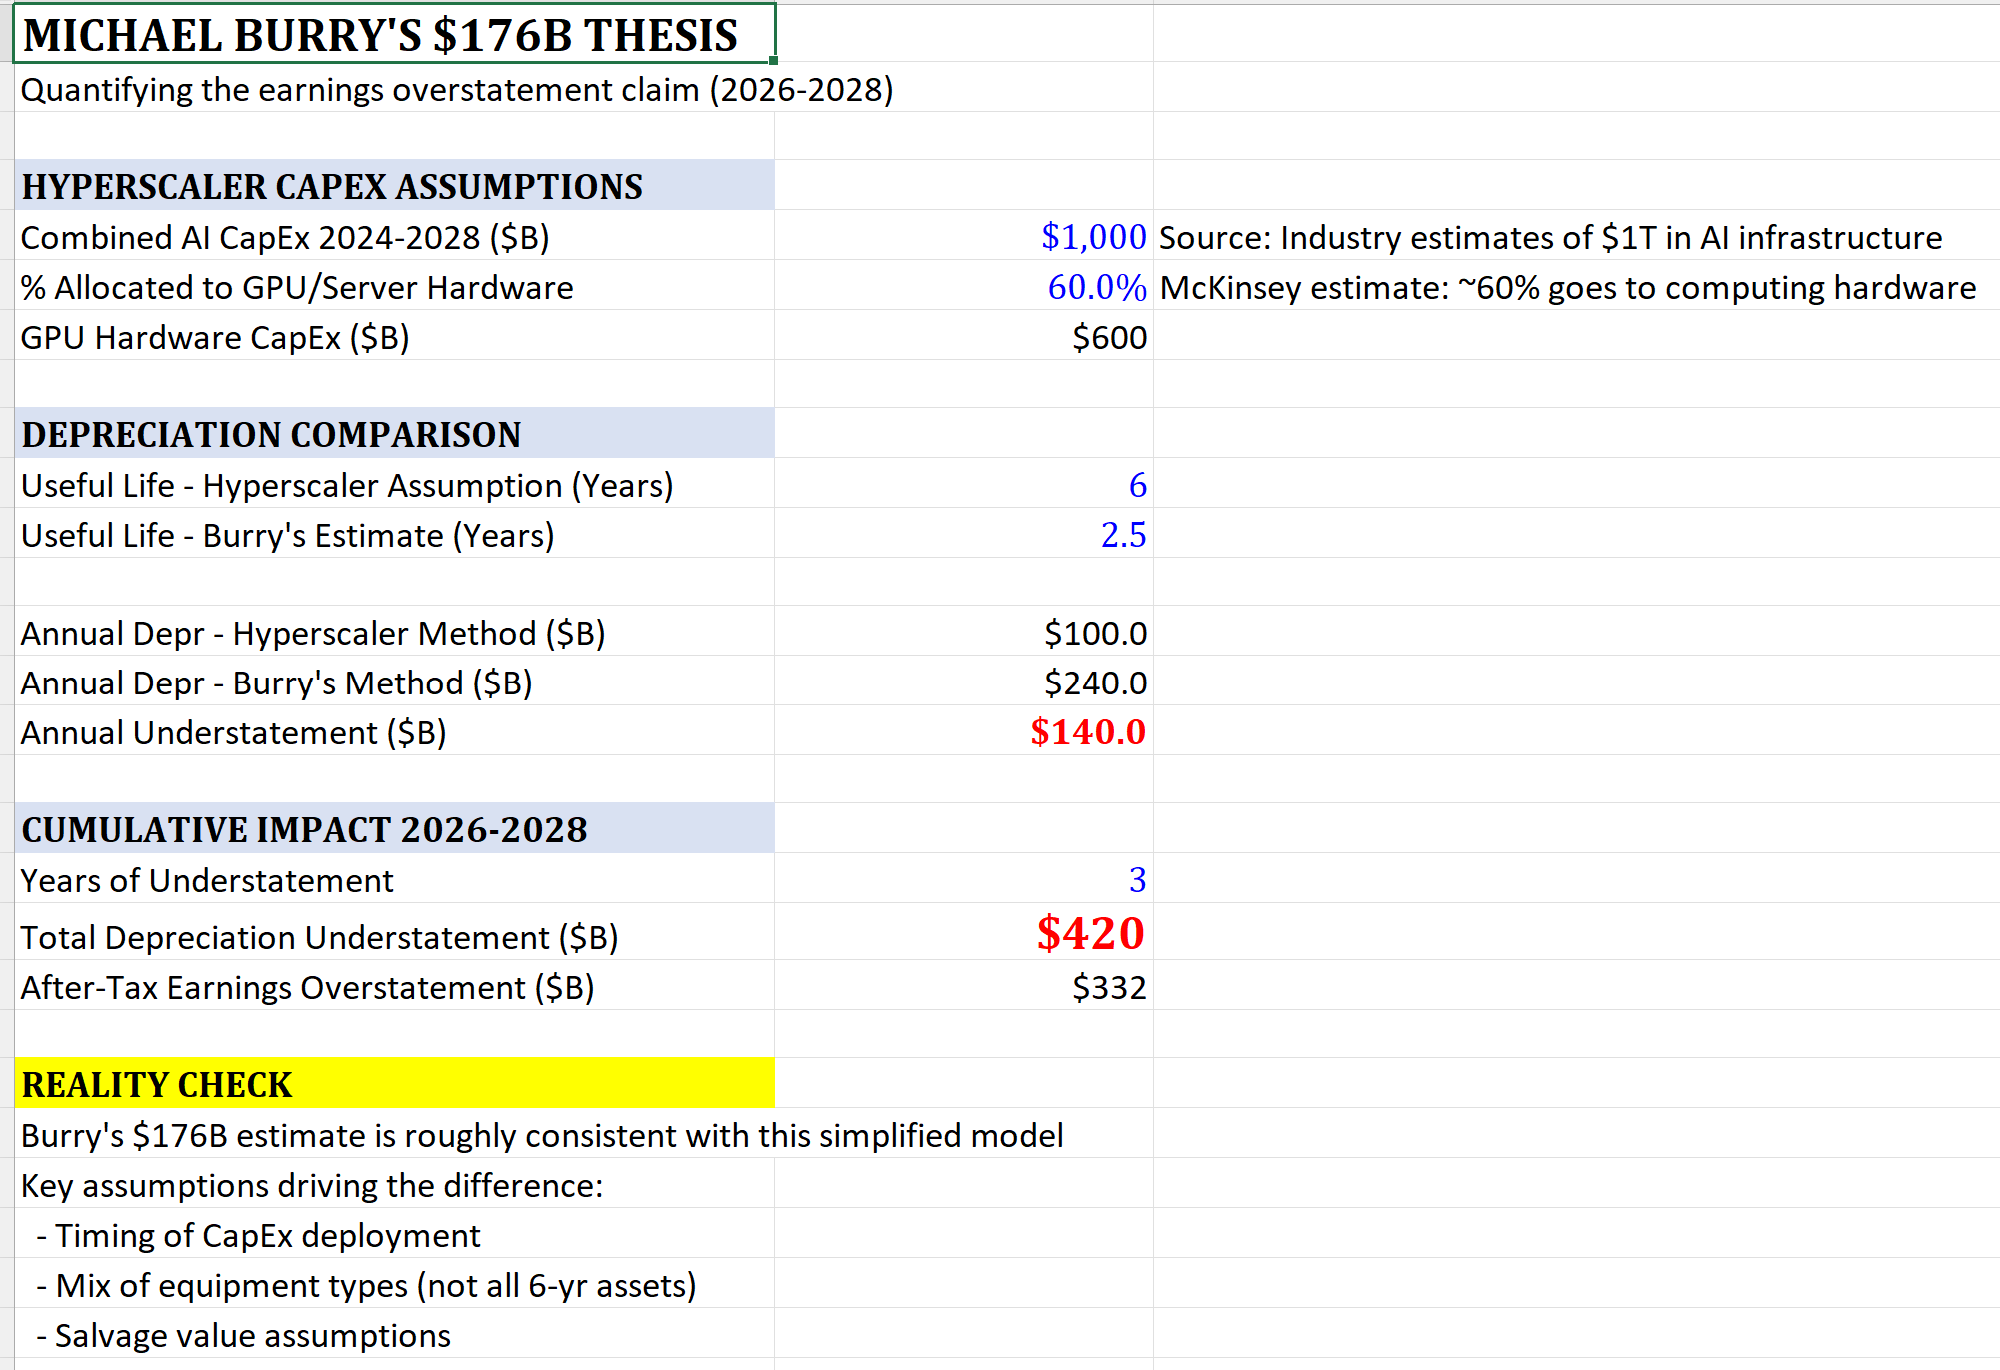
In November 2025, Michael Burry broke his silence on AI. He accused the hyperscalers of accounting manipulation. His claim: Meta, Amazon, Microsoft, Google, and Oracle are depreciating their Nvidia GPUs over five to six years when the real economic life is closer to two or three. The result, by his math, is $176 billion in understated depreciation and overstated profits between 2026 and 2028.
It’s the kind of accusation that sounds either paranoid or prophetic, depending on your view. But the numbers beneath Burry’s claim aren’t controversial. They’re public, audited, and hiding in plain sight. The only question is what they mean.
To understand this debate, I used Claude Opus 4.5 to build a toy financial model that shows how depreciation choices affect valuation. The model is discussed throughout this post. Paid subscribers can download the model and use it for their own analyses.
The Basics: What Depreciation Actually Does
When a company buys a $40,000 GPU, it doesn’t expense the full cost immediately. Instead, it spreads that cost over the asset’s useful life. This is an estimate of how long the equipment will contribute to revenue generation.
If you depreciate that $40,000 GPU over three years, you recognize roughly ($40,000 / 3 years) ≈ $13,333 in expense annually. Depreciate it over six years, and the annual expense drops to roughly $6,667. Same cash outlay, same equipment, but reported profits are dramatically different.
This matters because the numbers involved are enormous. The big five hyperscalers are expected to spend roughly $300 billion on capital expenditures in 2025, up from $217 billion in 2024. A significant chunk of that goes to GPU-based AI infrastructure. At this scale, every year added to the depreciation schedule shifts billions from the expense line to the bottom line.
The Great Divergence of 2025
The clearest evidence that useful life is a management choice rather than an engineering fact came in early 2025, when Amazon and Meta moved in opposite directions on the same technology.
Amazon shortened the useful life of a subset of its servers from six years to five, explicitly citing “the increased pace of technology development, particularly in the area of artificial intelligence and machine learning.” The company took a $700 million hit to operating income and recorded $920 million in accelerated depreciation charges.
In the same quarter, Meta extended its server useful lives to 5.5 years, booking a $2.9 billion reduction in depreciation expense. This was nearly 4% of estimated pre-tax profits for the year.
Same GPUs. Same Nvidia chips. Same technological environment. Opposite conclusions.
This divergence tells us something important: within the guardrails of GAAP, companies have substantial discretion over how they account for these assets. The question is whether that discretion is being used to reflect economic reality or to manage earnings.
The Bull Case: GPUs Have Multiple Lives
The defense of longer depreciation schedules rests on the “value cascade” theory. Today’s frontier training chips become tomorrow’s inference workhorses, which eventually become next year’s batch processing engines.
The framework works roughly like this: Years one and two are the “primary economic life,” where GPUs support foundational model training at peak performance. Years three and four become “secondary life,” handling high-value real-time inference where latency matters but raw training throughput doesn’t. Years five and six represent “tertiary life,” serving batch inference and analytics workloads that prioritize cost over speed.
CoreWeave CEO Michael Intrator made this case after his company’s November earnings: “All of the data points I’m getting are telling me that the infrastructure retains value.” He pointed to the company’s A100 chips, which remain fully booked, and H100s that were immediately re-leased at 95% of their original price when a contract expired.
Google’s VP of AI infrastructure, Amin Vahdat, stated that Google currently has seven generations of its TPU hardware in production and that its “seven and eight-year-old TPUs have 100 percent utilization.” The caveat: Google’s custom ASICs differ fundamentally from Nvidia GPUs.
Historical precedent offers some support. In 2020, Amazon extended server depreciation from three to four years, arguing that improved software efficiency and diverse workloads allowed hardware to remain productive longer. Microsoft and Google followed suit, and by 2023-2024, the industry had normalized on six-year schedules.
The Bear Case: Obsolescence Is Accelerating
Burry’s counterargument is simple: Nvidia’s innovation pace makes long depreciation schedules untenable.
The company now releases new AI chip architectures annually, versus the previous two-year cycle. Each generation brings substantial performance improvements. Jensen Huang himself joked at Nvidia’s GTC conference that “when Blackwell starts shipping in volume, you couldn’t give Hoppers away.” Hopper chips are “fine” for some circumstances, he added, but “not many.”
Even if the chips keep working, the economics deteriorate. H100 rental rates have dropped dramatically, from over $8 per hour in 2023 to $1-2 per hour by late 2024 at auction prices. Older hardware might stay “fully booked,” but at prices that make the original investment look increasingly questionable.
Microsoft CEO Satya Nadella acknowledged this tension directly: “One of the biggest learnings we had even with Nvidia is that their pace increased in terms of their migrations. That was a big factor. I didn’t want to go get stuck with four or five years of depreciation on one generation.”
A Toy Model: What This Actually Means
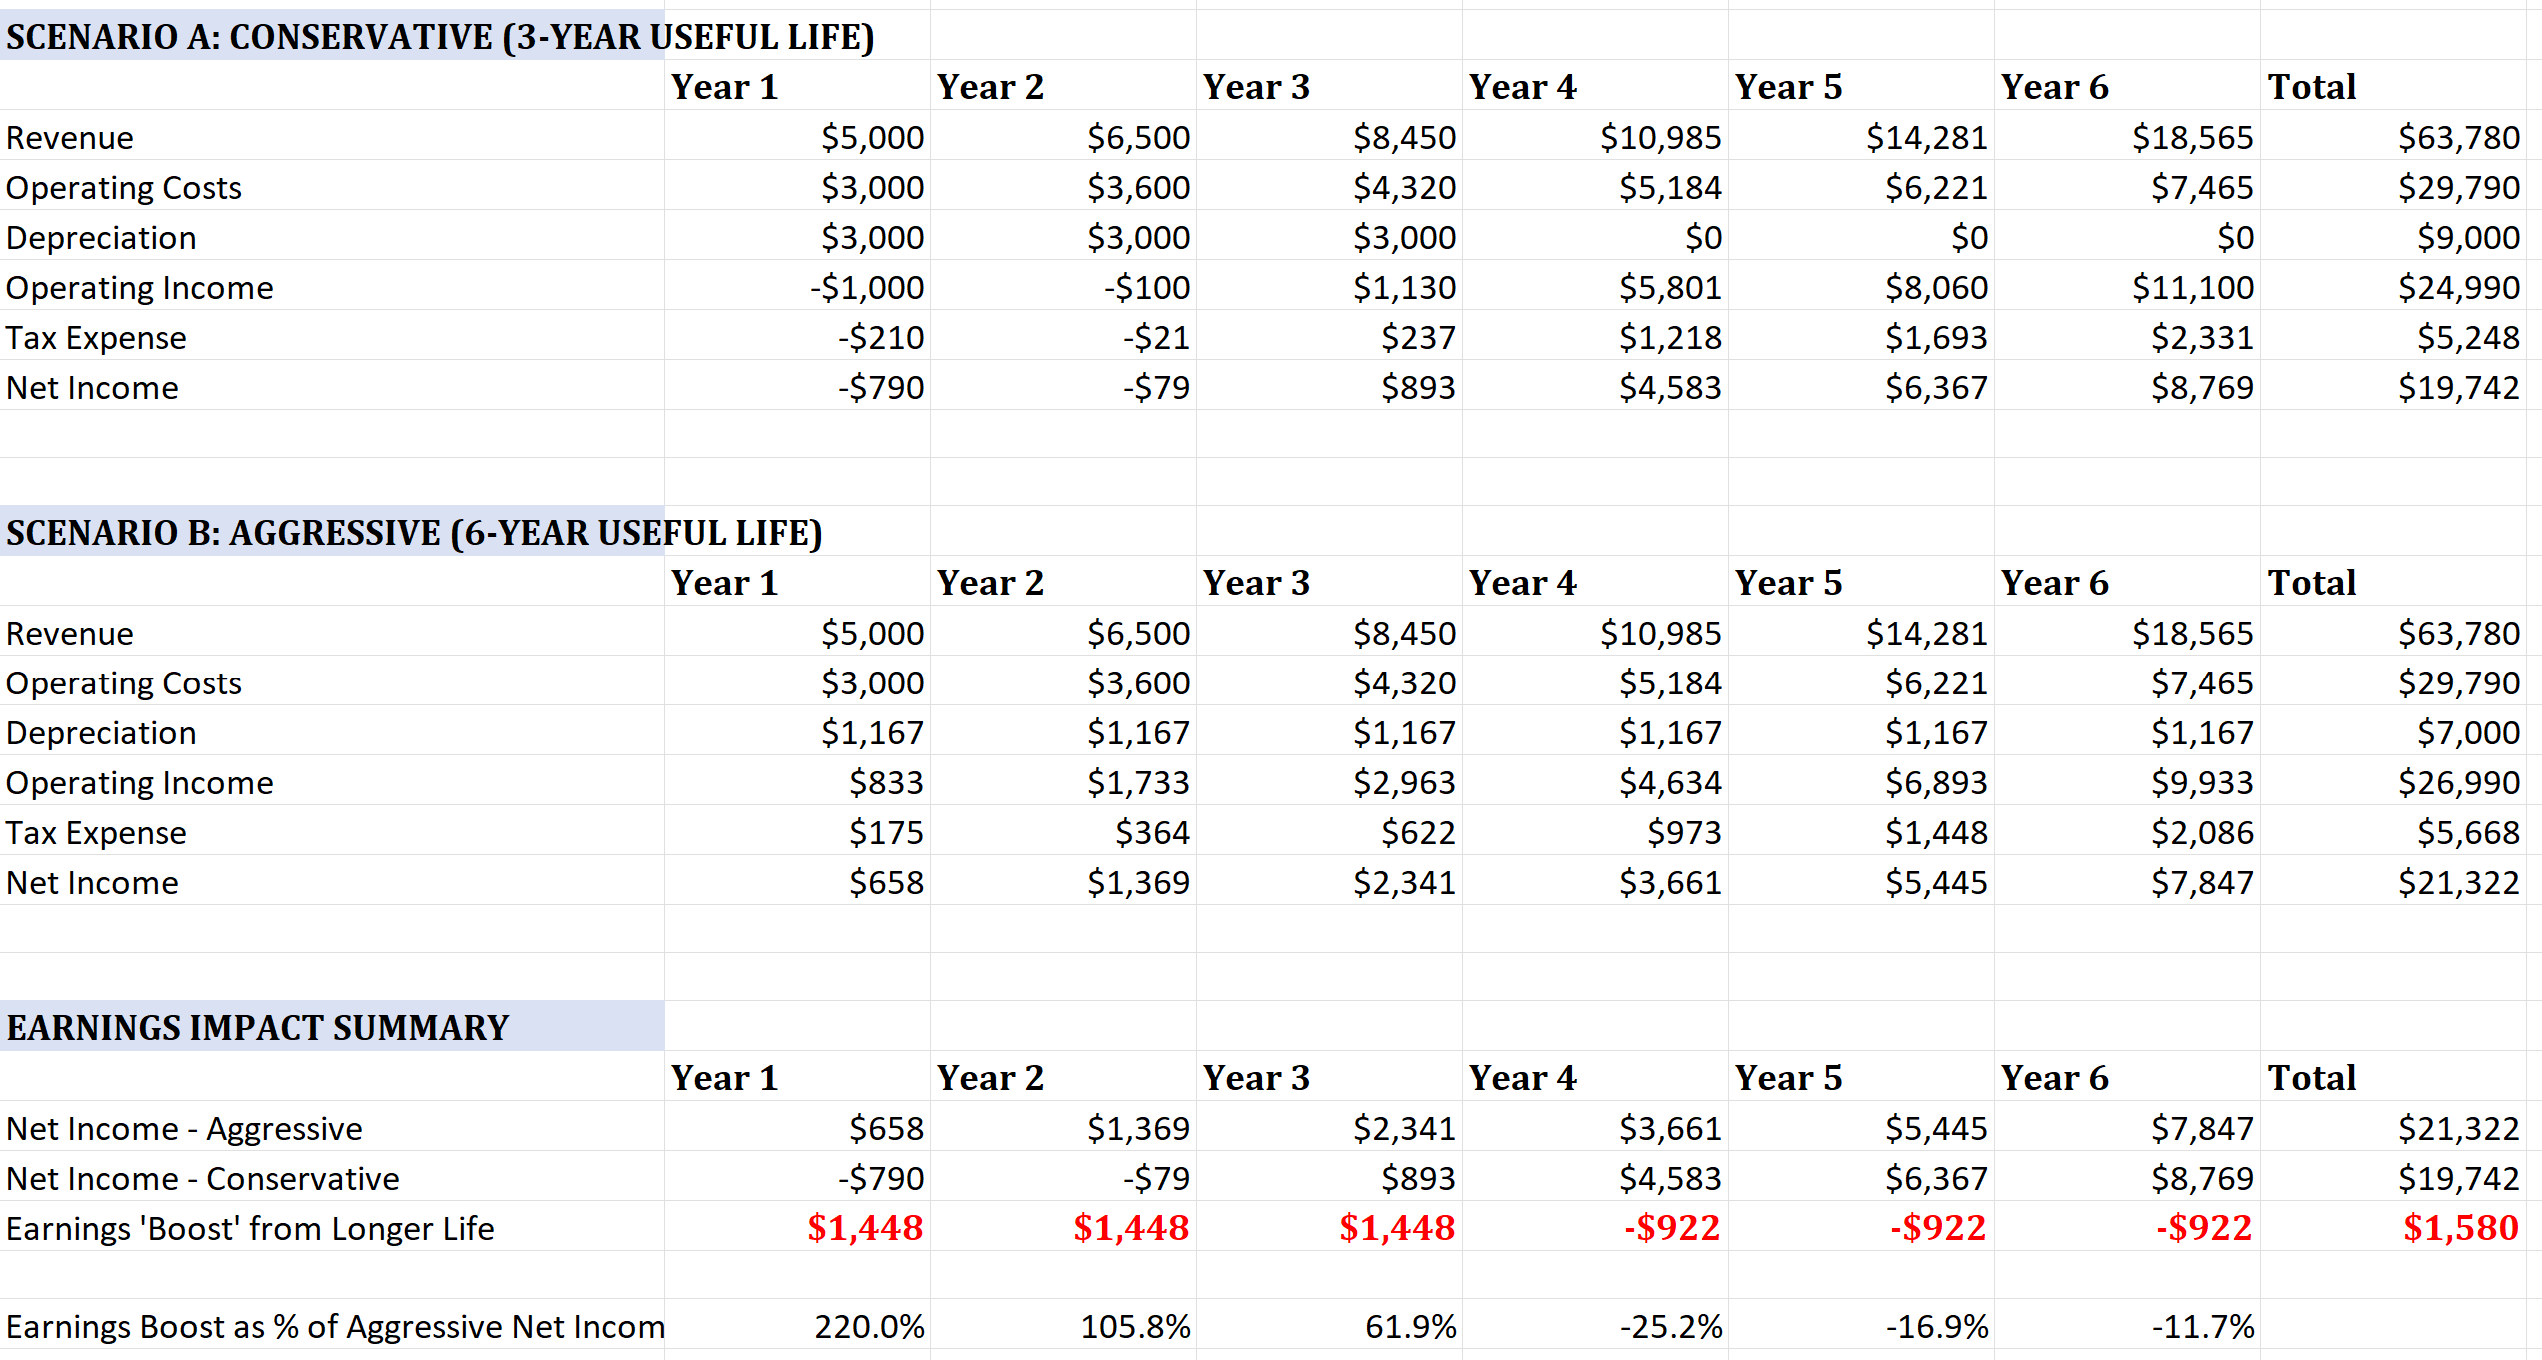
To understand the stakes, consider a simplified example. A company invests $10 billion in GPUs. Under conservative three-year depreciation, annual expense is roughly $3 billion. Under aggressive six-year depreciation, it’s roughly $1.2 billion.
That $1.8 billion annual difference flows straight to operating income. After taxes, we’re talking about $1.4 billion in additional reported profits per year, from accounting treatment alone.
Now scale this to the hyperscalers’ combined AI CapEx of $600+ billion in GPU hardware over the next few years. If the true useful life is three years rather than six, the industry is understating depreciation by $50-60 billion annually. Over Burry’s 2026-2028 window, that compounds to something in the neighborhood of his $176 billion estimate.
The Valuation Trap
Here’s where the debate gets interesting. There are two ways to think about how depreciation policy affects stock prices.
Framework 1: The market sees through accounting. Sophisticated investors know that depreciation is non-cash; the money left the building when the GPUs were purchased. A company’s free cash flow is identical regardless of whether it depreciates over three years or six. Under this view, stock prices should be the same because cash generation is the same. Only the P/E ratio varies, becoming a less useful metric when comparing companies with different depreciation policies.
Framework 2: Reported earnings drive prices. Index inclusion, screening models, analyst coverage, and passive flows all respond to EPS. Many quantitative strategies use reported earnings without adjusting for accounting policy differences. If aggressive depreciation makes a company look cheaper on a P/E basis, it may attract capital that wouldn’t otherwise flow to it. Under this view, accounting choices inflate real valuations.
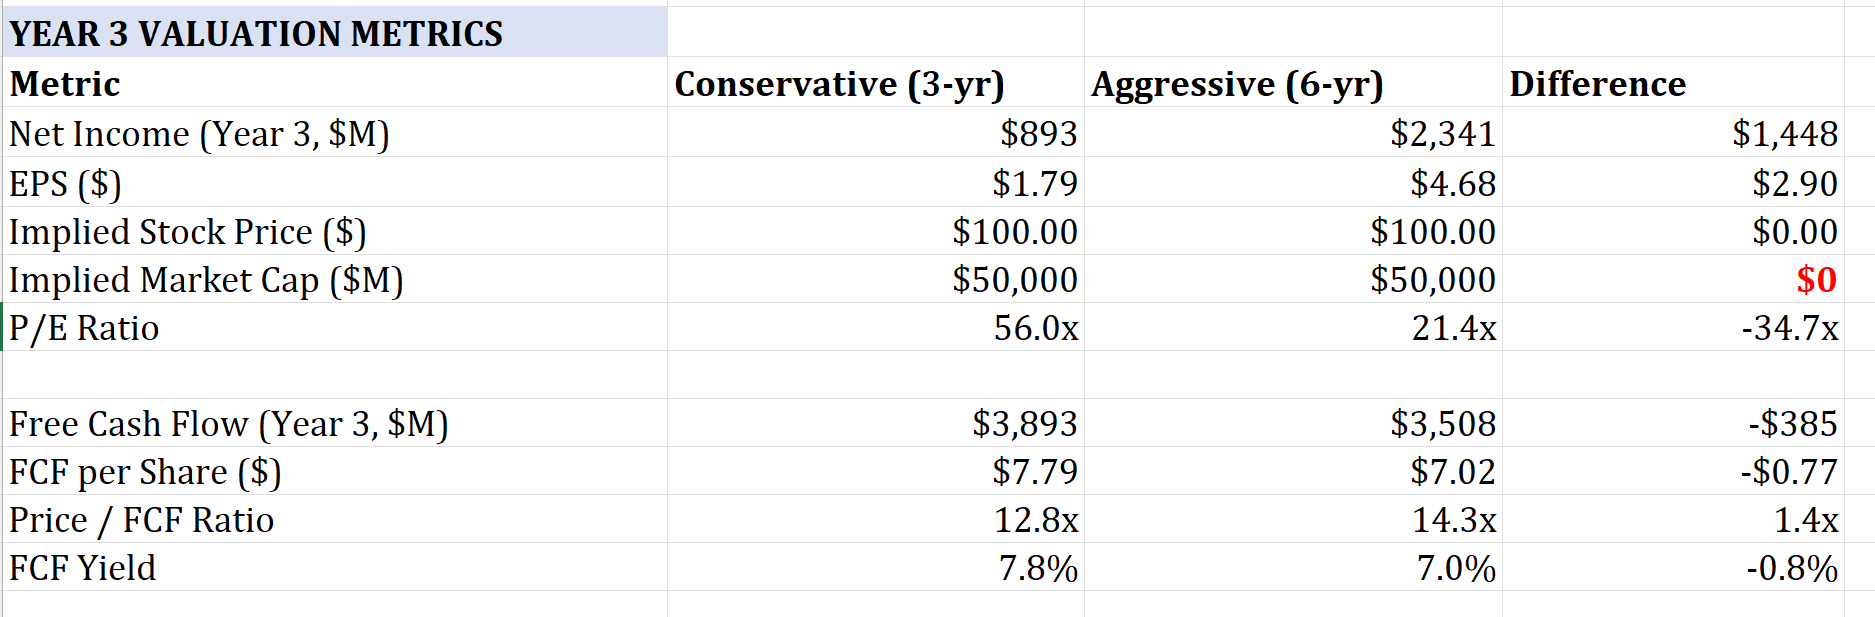
The difference between these frameworks is enormous. Consider two versions of the same company in year three of a GPU investment cycle. Under conservative depreciation, EPS is $1.79 and the P/E ratio is 56x. Under aggressive depreciation, EPS is $4.68 and the P/E is 21x. Same business, same cash generation, but one looks expensive and one looks reasonably valued.
If Framework 1 holds, the accounting is irrelevant and P/E comparisons are simply misleading. If Framework 2 holds, aggressive depreciation genuinely inflates market caps by tens of billions of dollars. This value evaporates the moment investors reprice on cash flows.
Evidence exists for both views. Amazon’s stock didn’t crater when it shortened useful lives and took an earnings hit. Meta’s didn’t soar when it extended them. But Burry’s implicit argument is that we’re closer to Framework 2 than most investors realize, and that the reckoning comes when impairment charges force the issue.
The Impairment Cliff
This brings us to the real risk: what happens if the market value of GPU fleets drops faster than book value?
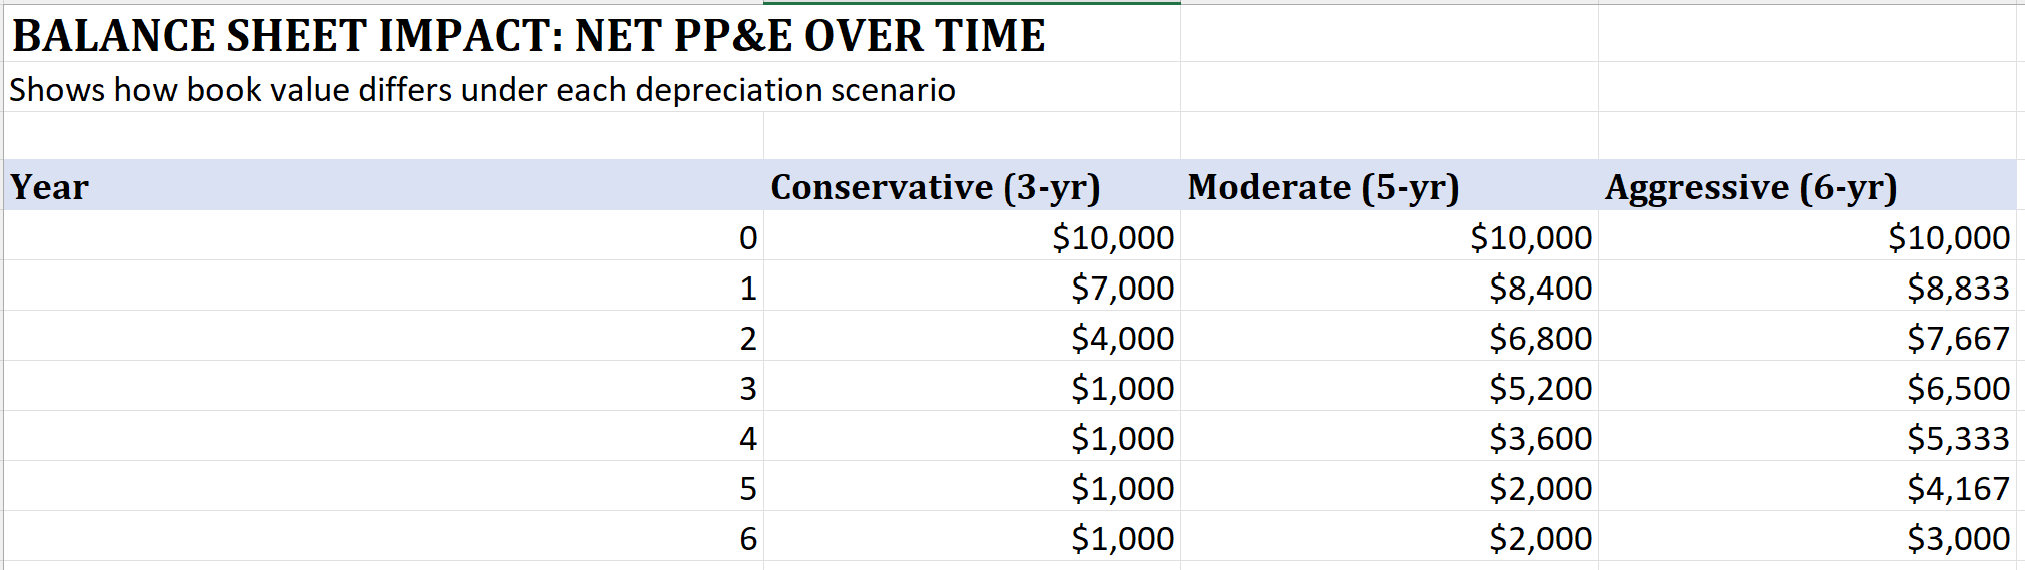
Under GAAP, companies must test long-lived assets for impairment when circumstances suggest carrying values may not be recoverable. If a company has $7 billion in net GPU assets on its books (reflecting six-year depreciation) and the market value drops to $3 billion (reflecting actual resale prices), the $4 billion difference must be written off immediately.
This is the scenario Burry is implicitly betting on: not fraud, but aggressive estimates meeting harsh reality. When the write-downs come, they won’t be spread over comfortable multi-year periods. They’ll hit in single quarters, crushing reported earnings and potentially triggering covenant issues for companies like CoreWeave that use GPUs as debt collateral.
What To Watch
For investors trying to navigate this, a few indicators matter:
Free cash flow vs. net income divergence. When reported profits grow but free cash flow stagnates or declines, depreciation policy may be masking true capital intensity. Meta’s free cash flow is projected to drop from roughly $54 billion in 2024 to around $20 billion in 2025 despite strong reported earnings. This is a dynamic worth understanding, even if the primary driver is increased CapEx rather than depreciation policy alone.
Secondary market GPU prices. The dramatic decline in H100 rental rates signals something about residual values. If resale markets continue to weaken, impairment risk rises.
Amazon’s behavior. Amazon was first to extend depreciation in 2020, and first to partially reverse in 2025. If the company with the largest cloud infrastructure footprint thinks five years is more realistic than six, that’s worth noting.
Hyperscaler disclosure quality. Companies that provide detailed breakdowns of equipment types, useful life assumptions, and sensitivity analyses are more trustworthy than those that bury everything in opaque PP&E line items.
The Bigger Picture
The GPU depreciation debate is ultimately a proxy for a deeper question: is the AI infrastructure buildout economically sustainable, or are we in a capex bubble dressed up in accounting?
Bulls see durable demand, workload diversification, and a technology cycle that creates perpetual use cases for yesterday’s hardware. Bears see accelerating obsolescence, deteriorating rental economics, and earnings quality that would make a 1990s telecom blush.
The comparison to telecom is instructive, but it cuts both ways. The late 1990s fiber buildout also featured aggressive depreciation, circular financing, and confidence that demand would justify the infrastructure. When the bubble burst, companies went bankrupt and their fiber was sold at fire-sale prices. New entrants bought that fiber for pennies and used it profitably for decades.
The AI cycle might not offer the same soft landing. Three-year-old GPUs at fire-sale prices don’t provide a competitive foundation when incumbents are running current-generation hardware. The infrastructure doesn’t become a public good the way dark fiber eventually did. It becomes e-waste.
The truth is probably somewhere in between. GPUs likely have longer useful lives than pure training economics would suggest, but shorter lives than current depreciation schedules assume. The hyperscalers are probably not committing fraud, but they’re almost certainly making optimistic estimates that will require adjustment.
What’s clear is that the accounting treatment of AI infrastructure has become material in a way it never was for traditional IT spending. When you’re deploying hundreds of billions of dollars into assets with uncertain longevity, the difference between a three-year and six-year depreciation schedule is the difference between a profitable buildout and an expensive mistake.
The $176 billion question isn’t whether Burry’s number is precisely right. It’s whether investors are paying attention to what’s hiding in plain sight on the balance sheet, and whether they’ll care before or after the write-downs arrive.
If you enjoy this newsletter, consider sharing it with a colleague.
I’m always happy to receive comments, questions, and pushback. If you want to connect with me directly, you can:
